Cycling Speed Estimator
How Google Maps Calculates Your Cycling Speed
Google Maps uses a dynamic model that combines historical data from cyclists, road type, elevation, and traffic conditions to estimate your cycling speed. This calculator simulates the same factors to help you understand why your travel time might differ from Google Maps.
Estimated Cycling Speed
Your estimated travel time:
How Google Maps calculates your speed
Your estimate is based on typical speeds for the selected conditions. Google Maps uses these factors to calculate your speed:
Ever wondered why the time estimate on Google Maps feels off when you’re on a bike? The answer boils down to the speed model Google Maps applies to cycling routes. Understanding the math behind the Google Maps cycling speed helps you plan better rides, avoid surprises, and even tweak your own expectations.
How Google Maps Calculates Cycling Speed
Google Maps doesn’t rely on a single constant like “15 km/h” for every rider. Instead, it blends several data sources to create a dynamic speed estimate that varies by location, elevation, and even the time of day.
When you request a bike route, the service pulls three main inputs:
- Historical travel data collected from anonymized cyclists using the app.
- Road‑type classification (bike lane, shared road, paved path, etc.).
- Physical factors such as slope and surface quality.
These inputs feed into a proprietary algorithm that outputs a "average cycling speed" for each segment of the route. The sum of all segment times becomes the ETA you see on the screen.
Key Data Sources Behind the Speed Model
To grasp why a segment through a flat park feels faster than a hill‑top climb, look at the data feeding the model.
- GPS provides real‑time location data from millions of devices. Google aggregates anonymized speed traces from cyclists who have GPS enabled, building a statistical picture of how fast people actually ride on specific streets.
- Elevation data measures the rise and fall of terrain using satellite and LIDAR surveys. Steeper grades reduce the assumed speed, while downhill stretches boost it.
- OpenStreetMap supplies road classification, bike lane tags, and surface types. A dedicated bike lane gets a higher baseline speed than a busy arterial road.
Beyond these, Google also considers traffic patterns (even though cars dominate traffic data, the same rush‑hour congestion can slow cyclists) and seasonal adjustments (wet seasons lower average speeds).
What Speed Does Google Maps Show?
Google never publishes a single "cycling speed" number because it changes constantly. However, community tests and unofficial studies give us a ballpark:
- In dense urban cores with bike lanes, the model averages around 18-20 km/h (11-12 mph).
- On mixed‑traffic streets without dedicated lanes, speeds drop to 12-14 km/h (7-9 mph).
- On off‑road trails or dedicated paths, the estimate can rise to 22-25 km/h (14-16 mph) if the terrain is flat.
These figures are not hard limits; they shift if the segment’s slope exceeds 5 % or if historical data shows cyclists regularly slow down for traffic lights.
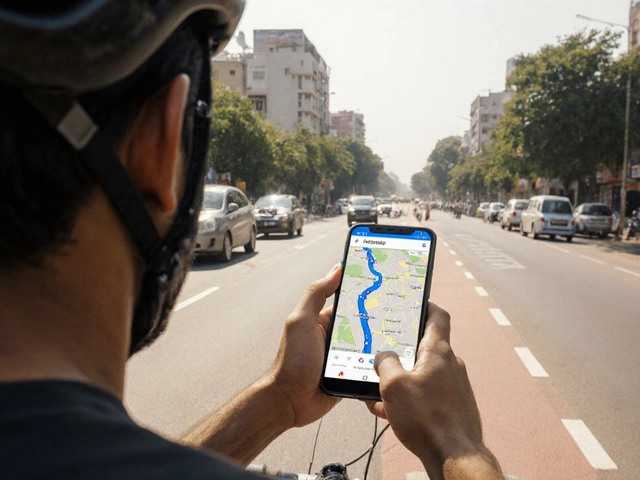
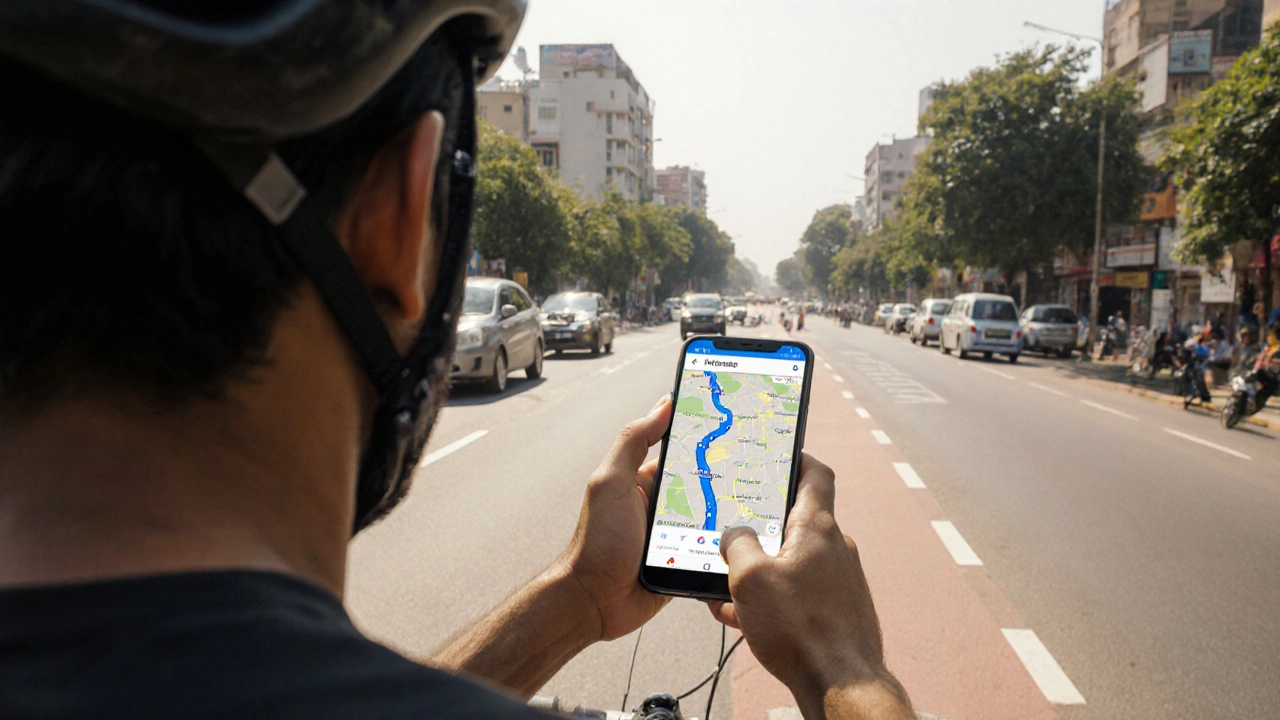
How the Speed Shows Up in the App
When you start a bike route, Google Maps displays a few cues that reveal the speed model:
- The ETA at the top of the screen is a sum of per‑segment travel times.
- If you tap the route preview, a small speedometer icon appears, showing the "average speed" for the selected segment.
- During navigation, the voice prompt says things like "You will arrive in 12 minutes," reflecting the live‑adjusted speed as you progress.
There’s no setting to manually adjust the speed; you can only influence it by choosing alternative routes (e.g., selecting a path with more bike lanes).
Factors That Can Skew the Estimate
Even with a sophisticated model, a few real‑world details can make the ETA feel off:
| Factor | Description | Typical Impact on Speed |
|---|---|---|
| Road type | Dedicated bike lane vs shared road | +3-5 km/h for lanes |
| Elevation | Average grade of the segment | -2 km/h per 5 % incline |
| Surface | Paved vs gravel or dirt | -1-2 km/h for rough surfaces |
| Traffic density | Peak‑hour congestion | -2-3 km/h in heavy traffic |
| Weather | Rain or strong wind | -1-2 km/h on rainy days |
Notice how each factor nudges the baseline speed up or down. The algorithm adds up these adjustments segment by segment.
Tips for Getting More Accurate Estimates
If you want Google Maps to give you a closer guess to your own riding style, try these practical steps:
- Enable Bicycle mode in Google Maps before you start the route. The app then pulls bike‑specific data instead of generic road data.
- Choose routes that favor dedicated bike lanes. You’ll see higher average speeds and more realistic ETAs.
- Check the elevation profile (tap the route line). If the climb looks steep, expect the ETA to be conservative.
- In heavy rain, add a few minutes to the estimate yourself. The model doesn’t fully account for wet‑road slowing.
- Use a dedicated cycling GPS device or a bike‑mounted speedometer to track your personal average speed, then compare it with Google’s estimate. Over time you’ll learn how the app’s model aligns with your own pace.
Common Misconceptions About Google Maps Cycling Speed
Many cyclists assume Google Maps uses a fixed speed like 15 km/h. That’s not true. The speed is context‑aware and changes every few meters based on the data points listed earlier. Another myth is that you can manually set a speed in the app-Google doesn’t provide such a knob; the only way to affect it is by picking a different route.
Finally, some riders think the ETA is only useful for cars. In reality, the same algorithmic principles work for bikes, just with different baselines. Understanding the underlying model lets you interpret the ETA more intelligently.
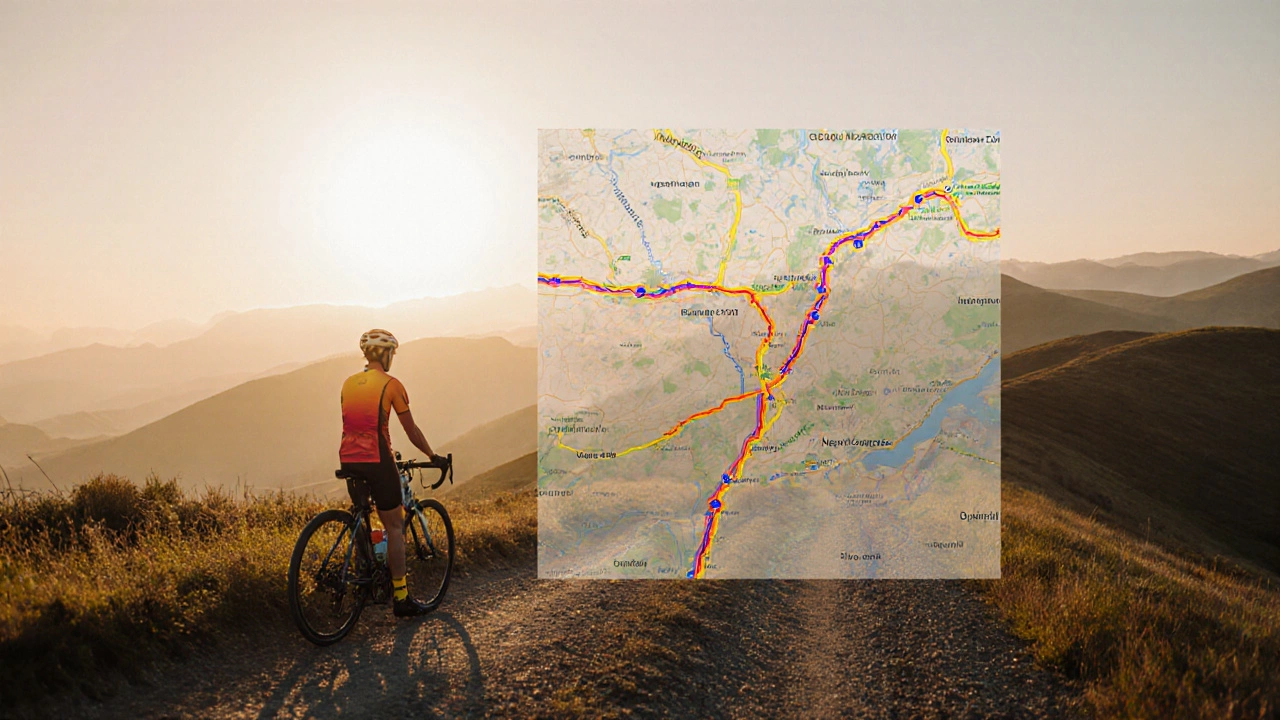
When to Trust the Estimate-and When to Plan Ahead
For short commutes (under 10 km), Google’s estimate is usually within a 5‑minute window, which is fine for most daily rides. For longer tours or races, treat the ETA as a rough guide; you’ll likely need to add a safety margin, especially if the route includes steep climbs or unpaved sections.
In competitive scenarios, many cyclists export the route to a dedicated bike computer that uses their personal speed profile. That approach beats any generic model, but for everyday navigation Google Maps remains a handy, free option.
Bottom Line
Google Maps calculates cycling speed by blending historical GPS traces, elevation data, and road‑type classifications. The result is a fluid, segment‑by‑segment speed that averages 12-25 km/h depending on the environment. While you can’t tweak the speed directly, you can influence the estimate by choosing bike‑friendly routes, checking elevation, and accounting for weather.
Next time you see an ETA that feels too optimistic, remember the algorithm’s assumptions and adjust your expectations accordingly. Happy riding!
Frequently Asked Questions
Does Google Maps have a fixed cycling speed?
No. Google Maps builds a dynamic speed for each road segment using historical GPS data, elevation, road type, and traffic conditions.
Can I change the speed setting in Google Maps?
There’s no manual speed slider. The only way to affect the model is by selecting different routes that have more bike lanes or flatter terrain.
How accurate is the ETA for a 20‑km ride?
For typical urban routes, the ETA is usually within ±5 minutes. Accuracy drops on routes with significant climbs, unpaved sections, or adverse weather.
Does traffic data affect bike speed estimates?
Yes, although traffic data primarily reflects vehicle flow, the algorithm reduces bike speed during peak‑hour congestion because cyclists often have to stop or slow down.
Why does the speed drop on a flat road with a bike lane?
If the historical GPS traces for that segment show cyclists riding slower-perhaps due to heavy pedestrian traffic-the model will lower the assumed speed despite the flat terrain.